

Performance Dashboard: Infrastructure
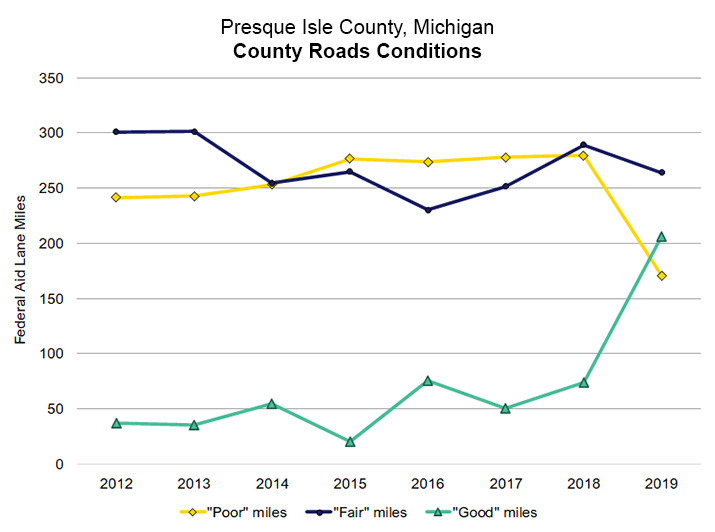
Road Conditions
Traffic
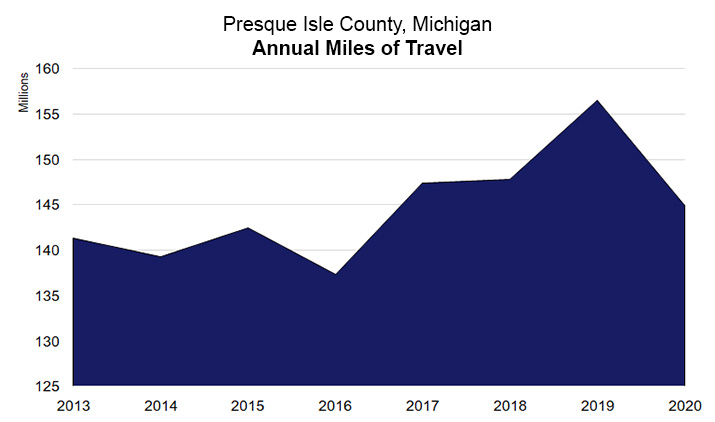
Miles Traveled
2013 - 2020
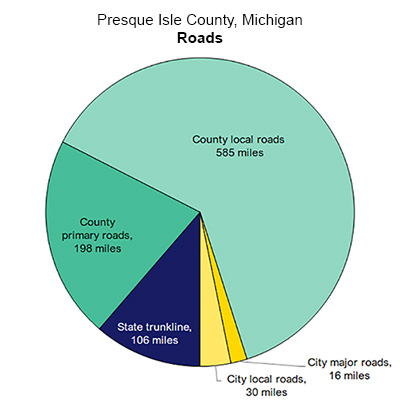
All Roads
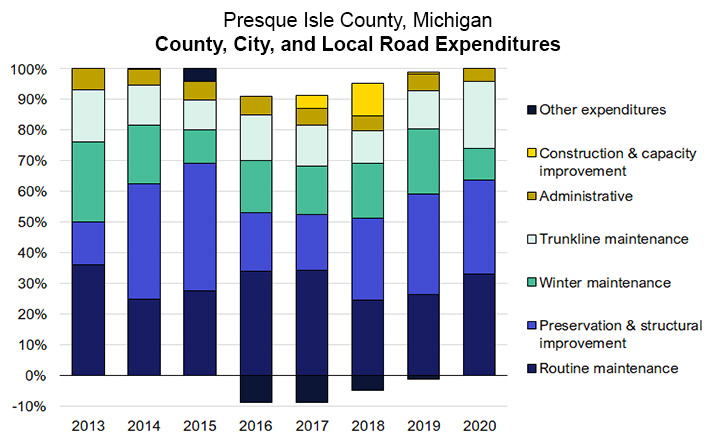
Expenditure Uses
Road Conditions
2012 - 2019
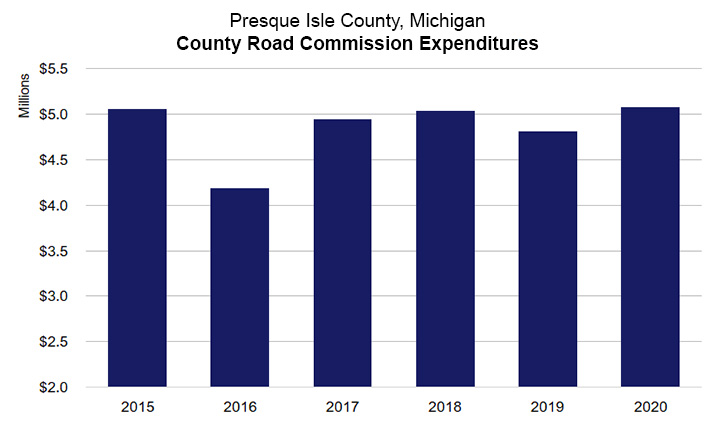
County Road
Commission
Expenditures
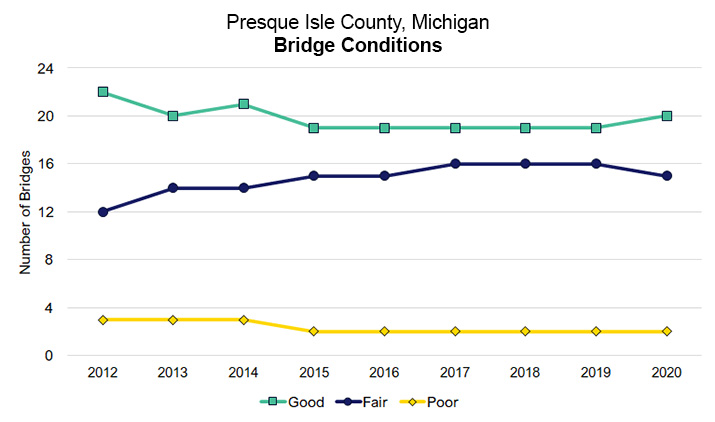
Bridge Conditions
2012 - 2020
| Road Conditions | 2018 | 2019 | % Change | Trend |
|---|---|---|---|---|
County Road Commission roads - Federal Aid lane miles |
||||
"Good" miles |
64.9 |
123.8 |
90.8% |
 |
"Fair" miles |
106.1 |
132.9 |
25.3% |
 |
"Poor" miles |
253.1 |
165.9 |
- 34.5% |
 |
All county roads - Federal Aid lane miles |
||||
"Good" miles |
74.0 |
206.0 |
178.4% |
|
"Fair" miles |
289.3 |
264.3 |
- 8.6% |
 |
"Poor" miles |
279.5 |
170.9 |
- 38.9% |
|
Miles traveled |
147,813,713 |
156,475,420 |
5.9% |
|
Favorable, Positive Change
Unfavorable, Negative Change
Favorable, Negative Change
Unfavorable, Positive Change
Neutral (+/- <1%) Change
Neutral, Positive Change
Neutral, Negative Change
Prepared by MGT of America Consulting, LLC
Performance Solutions Group
2343 Delta Road
Bay City MI, 48706