

Performance Dashboard: Economic Strength
Economic Strength
2 year comparison
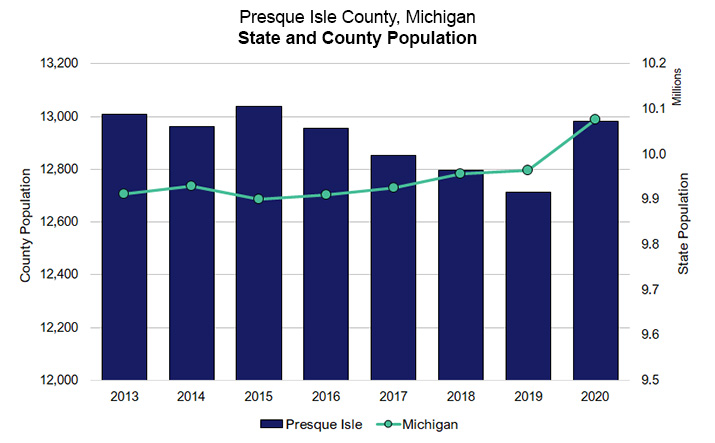
Population
2013 - 2020
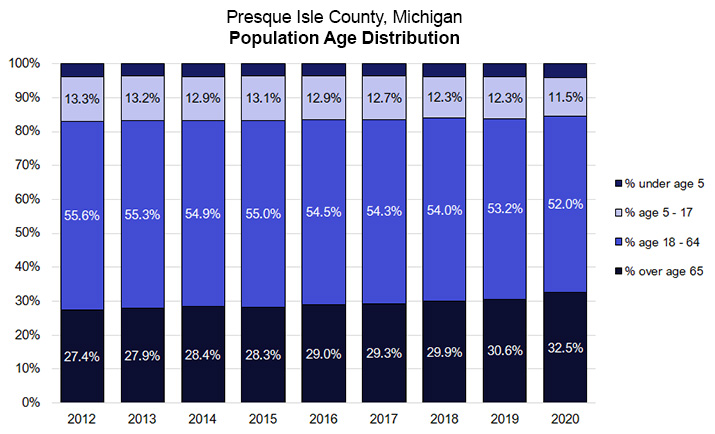
Age Distribution
2012 - 2020
Click here to see multi-year trend graphs for
Economic Indicators and Education statistics
| Economic Strength Indicators | 2018 | 2019 | 2020 | % Change | Trend |
|---|---|---|---|---|---|
Michigan state population |
9,957,488 |
9,965,265 |
10,077,331 |
1.1% |
 |
Presque Isle county population |
12,797 |
12,714 |
12,982 |
2.1% |
|
Percent under age 5 |
3.8% |
3.9% |
4.0% |
2.6% |
 |
Percent 5 to 17 years old |
12.3% |
12.3% |
11.5% |
- 6.5% |
 |
Percent 18 to 64 years old |
54.0% |
53.2% |
52.0% |
- 2.3% |
|
Percent age 65 and over |
29.9% |
30.6% |
32.5% |
6.2% |
 |
Economic Indicators |
|||||
Median household income |
$ 46,439 |
$ 47,948 |
n/a |
3.2% |
|
Per capita income |
$ 26,503 |
$ 28,103 |
n/a |
6.0% |
|
Unemployment rate |
8.9% |
7.2% |
n/a |
- 19.1% |
 |
Percent living below poverty level |
14.6% |
13.1% |
n/a |
- 10.3% |
 |
Education Statistics |
|||||
Percent of population, Bachelor's degree or higher |
17.3% |
17.9% |
n/a |
3.5% |
|
Percent of population, High school graduate |
89.1% |
89.6% |
n/a |
0.6% |
|
Favorable, Positive Change
Unfavorable, Negative Change
Favorable, Negative Change
Unfavorable, Positive Change
Neutral (+/- <1%) Change
Neutral, Positive Change
Neutral, Negative Change
Prepared by MGT of America Consulting, LLC
Performance Solutions Group
2343 Delta Road
Bay City MI, 48706